Lansing Real Estate Details
Properties For Sale & Real Estate
Search More Properties
Lansing
Search More Properties
Lansing
Lansing
Lansing Real Estate Statistics
Total Properties
90
Avg. Size in Sq. Ft.
1,548
Avg. Age in Years
0.3
Average Days on Site
114
Minimum Price
$19,999
Maximum Price
$1,499,000
Avg. Price
$188,502
Avg. Price per Sq. Ft.
$115
Recently Listed in Lansing
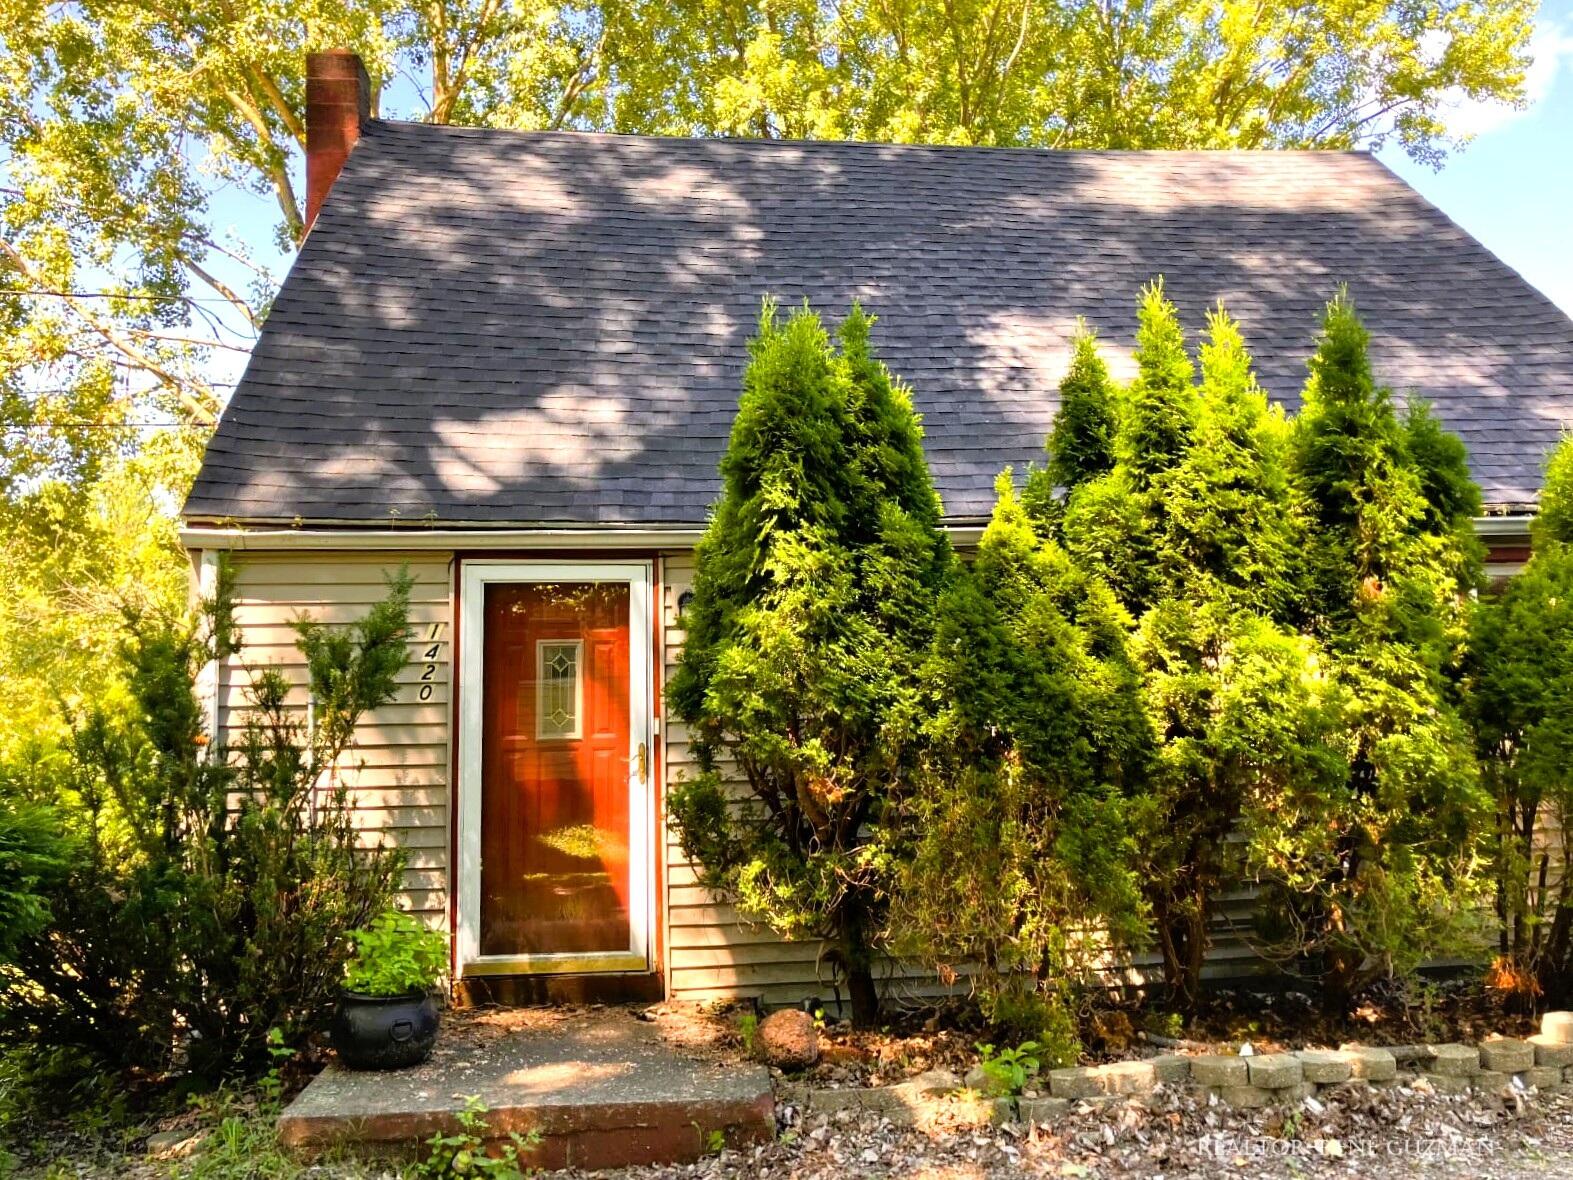
$150,000

3bds 1ba1,039sqftActive
1420 Reo Road, Lansing, MI 48910
MLS #: 25036096
1st Advantage Realty
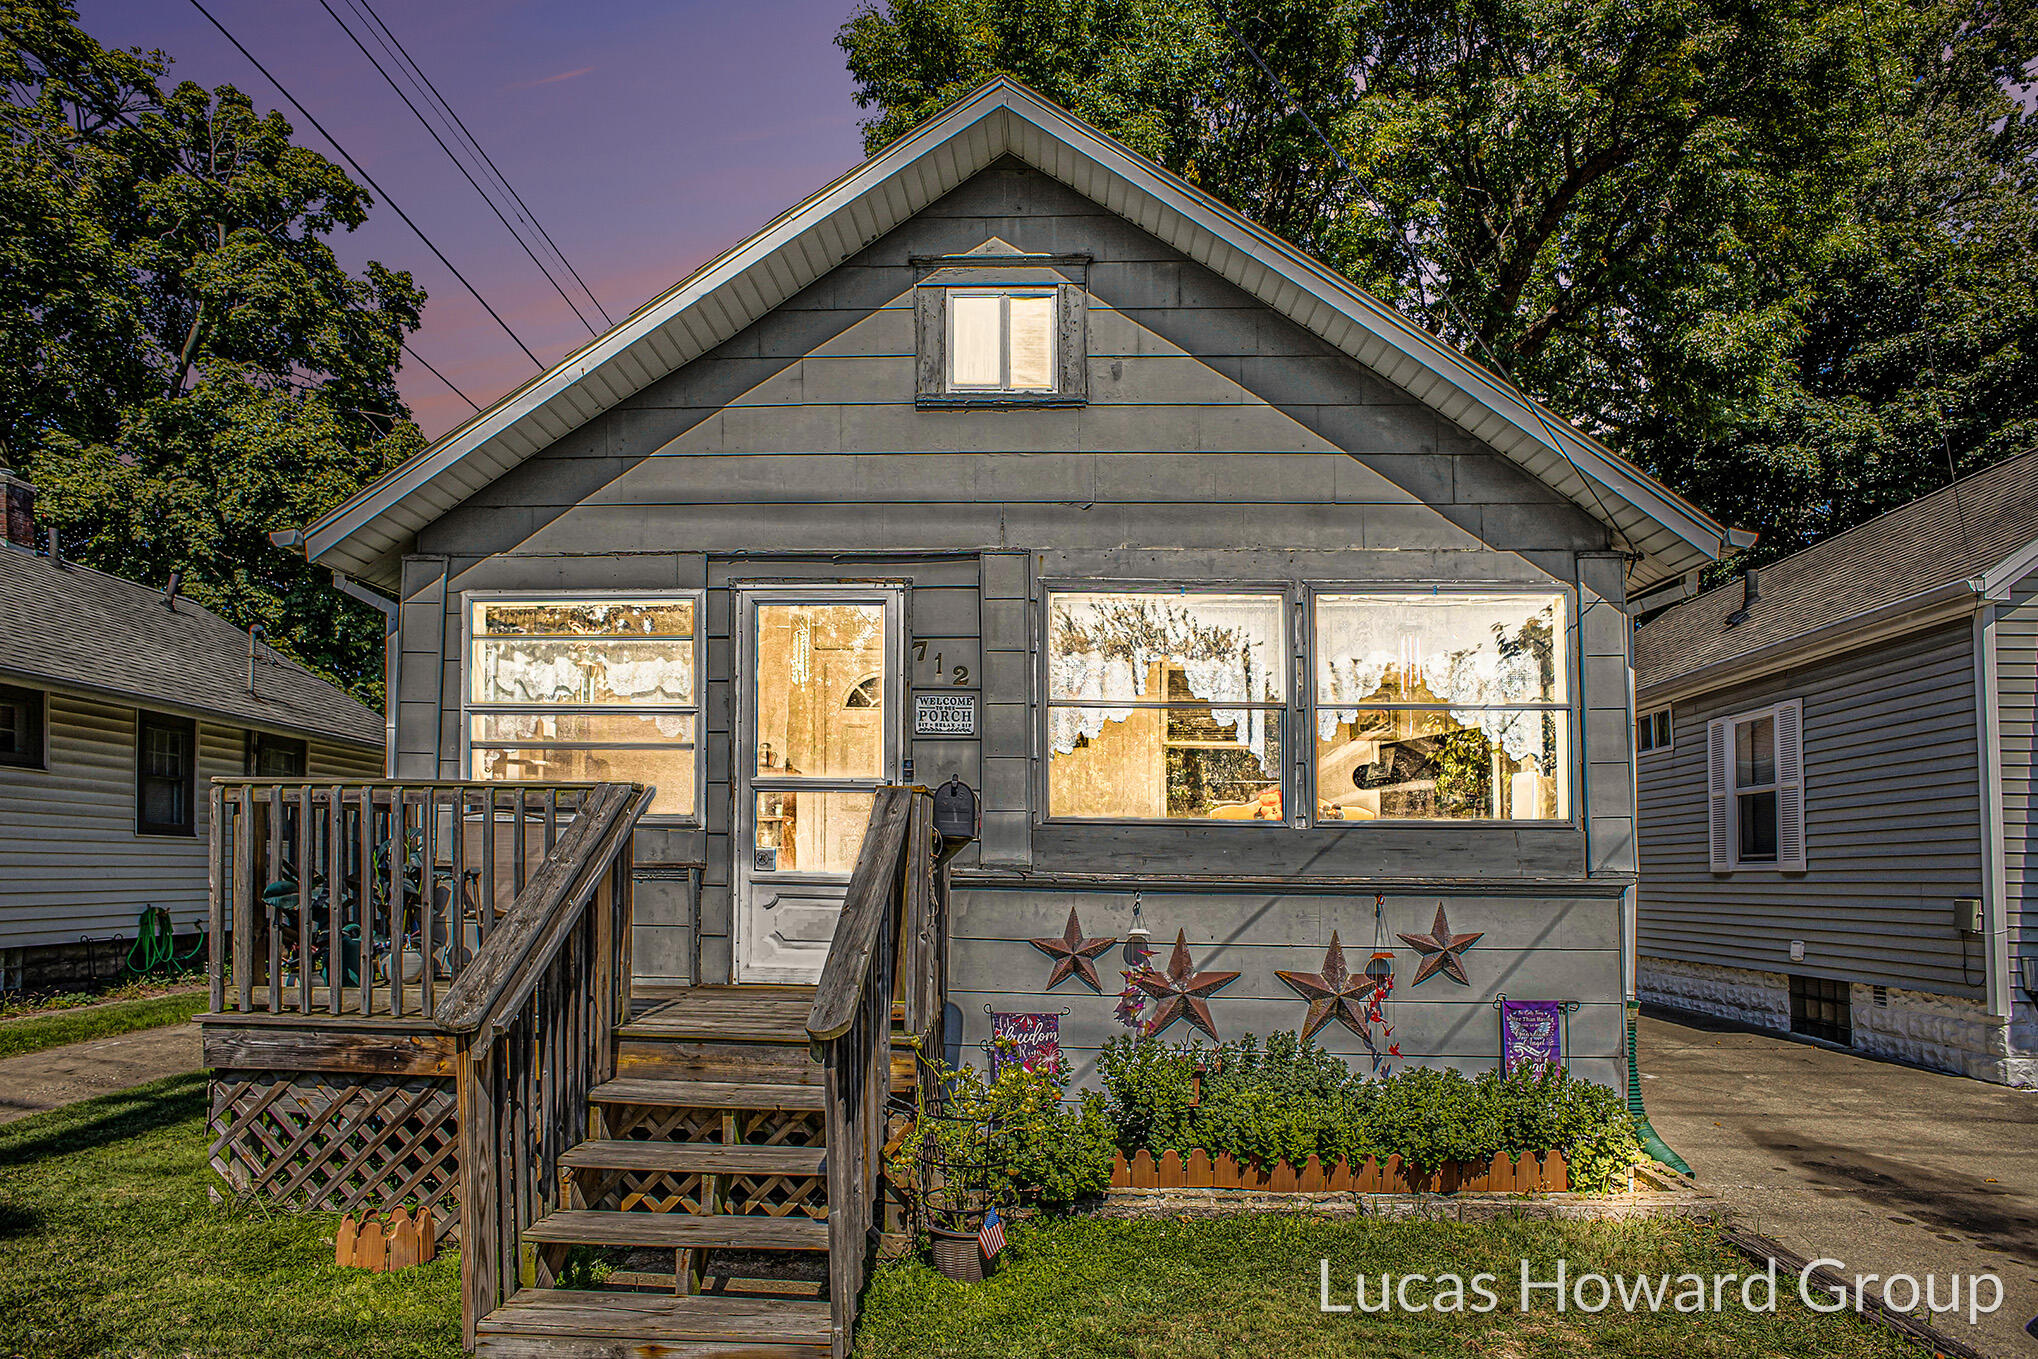
$100,000
2bds 1ba1,360sqftActive
712 Lenore Avenue, Lansing, MI 48910
MLS #: 25047774
Keller Williams GR East

$250,000
0.49 acre lot$510,204/AcreActive
1265 Roth Drive, Lansing, MI 48911
MLS #: 25056663
EXP Realty LLC
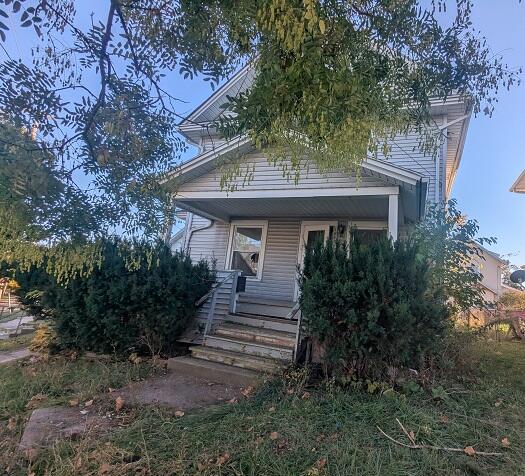
$44,900
3bds 1ba1,152sqftPending
1440 E Cesar E Chavez Avenue, Lansing, MI 48906
MLS #: 25059542
Willingham Real Estate

$82,000
2bds 1ba640sqftActive
1317 Illinois Avenue, Lansing, MI 48906
MLS #: 25060150
EB Realty LLC
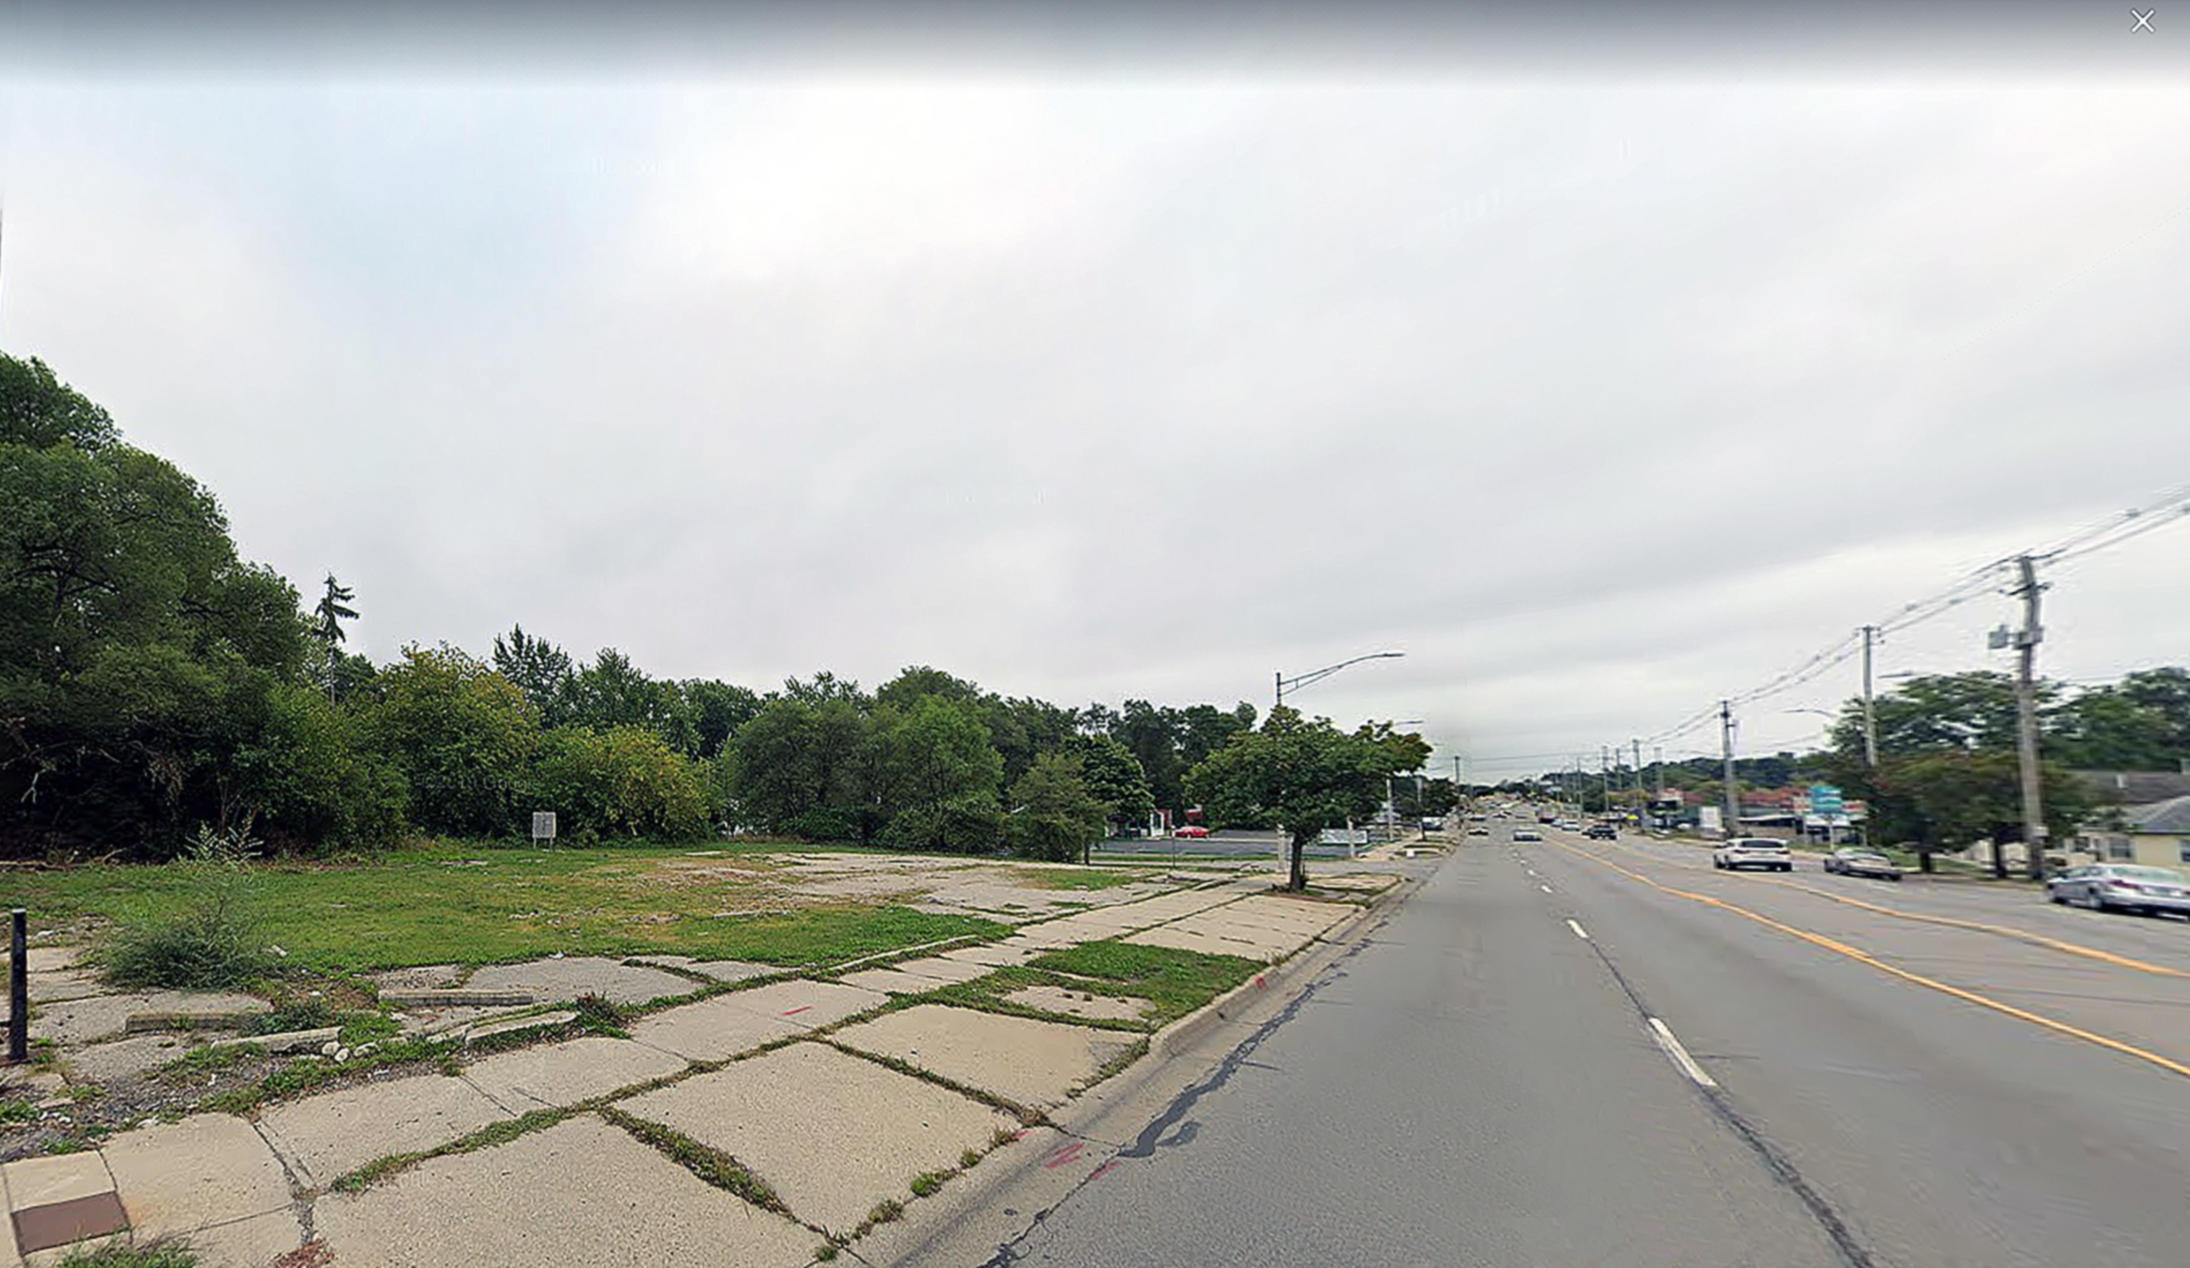
$70,000
0.52 acre lot$134,615/AcreActive
3145 S Cedar Street, Lansing, MI 48910
MLS #: 21099616
NAI Wisinski of West Michigan

$59,500
4bds 1ba648sqftPending
3428 W Jolly Road, Lansing, MI 48911
MLS #: 25062239
Willingham Real Estate
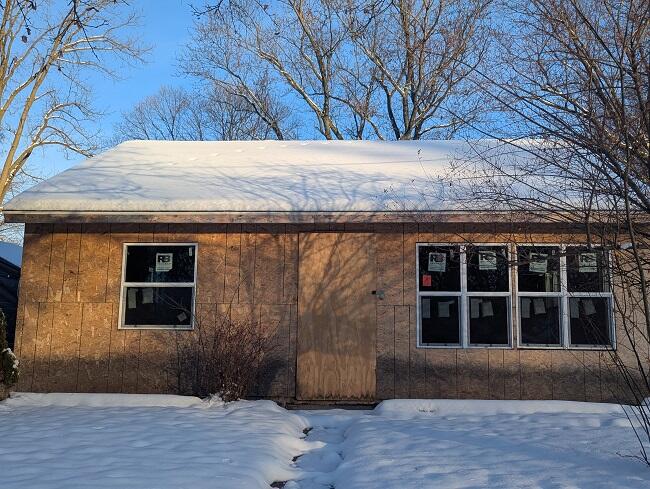
$29,900
2bds 1ba1,305sqftPending
1706 Robertson Avenue, Lansing, MI 48915
MLS #: 25062721
Willingham Real Estate

$130,000
$ 90.34/sqftF CommercialZoningActive
4108 S Cedar Street, Lansing, MI 48910
MLS #: 25062926
eXp Realty, LLC

$450,000
$ 36.17/sqft-ZoningActive
1819 W Willow Street, Lansing, MI 48915
MLS #: 26002417
Re/Max Real Estate Professionals
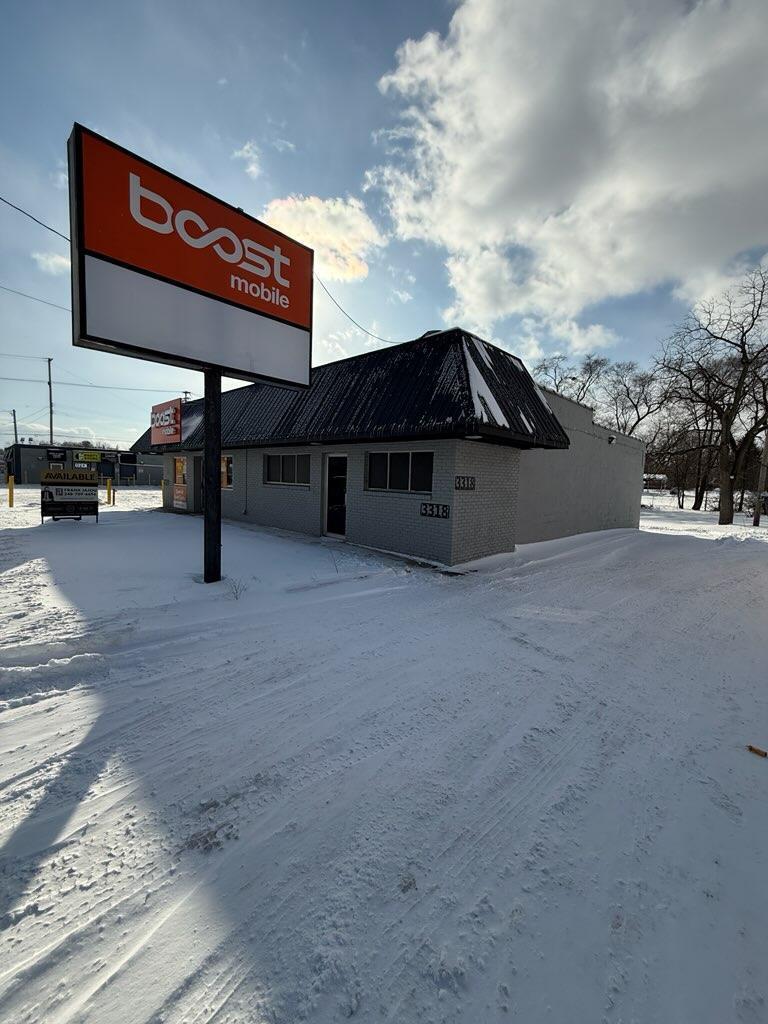
$279,000
$ 111.60/sqftCommercialZoningActive
3318-3320 S Cedar St, Lansing, MI 48910
MLS #: 26003042
BHHS Kee Realty
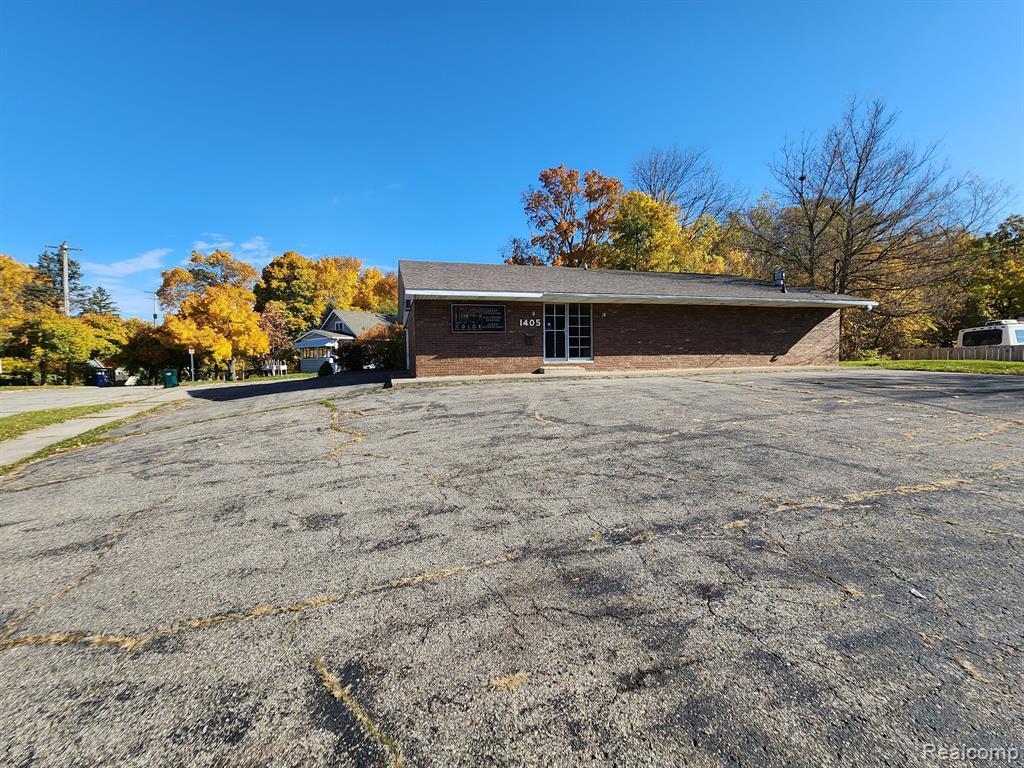
$199,999
$ 77.52/sqft-ZoningActive
1405 E César E. Chávez Avenue, Lansing, MI 48906
MLS #: 26003044
BHHS Kee Realty
Lansing Real Estate By Price
Demographic Information
Ingham County
282,015
Populations as of 2026150,091
Total Labor Force$64,354
Median Household Income$37,347
Per Capita Income33
Median Age2
Average Household Size11.2%
High School Graduate14%
Bachelor Degree Or HigherPopulation
2026 Estimate (V2026)
282,015
Age Distribution (Years Old)
0 to 4
5.3%
5 to 17
14.5%
18 to 64
65.7%
65 and Older
14.6%
Gender
Male
48.9%
Female
51.1%
Computer and Internet Use
Households with a computer
41.3%
Households with a broadband Internet subscription
41.3%
Language
English or Second Language, Age 5+
12.5%
English is First Language, Age 5+
82.2%
Veterans
Veterans
11,013
Housing
Total Housing Units
125,812
Households
116,566
Average Household Size
2 people
Owner-Occupied
24.6%
Multi-Family
2.1%
Owner-Occupied Median Value
$187,500
Median selected monthly owner costs - with a mortgage
$1,464
Median selected monthly owner costs - without a mortgage
$659
Median Gross Rent
$1,058
Year at Residence
1 Year or More
19.3%
Less Than 1 Year
80.7%
Business and Employment
Private non-farm Establishments
-
Private non-farm Employment
-
Nonemployer Establishments
20,930
Number of Firms
-
Business Production
Value of Shipments
-
Wholesale Trade
-
Retail Trade
-
Retail Sales Per Capita
-
Accommodation and Food Services
-
The American Community Survey (ACS) is an ongoing survey that provides data every year - giving communities the current information they need to plan investments and services. The ACS covers a broad range of topics about social, economic, demographic, and housing characteristics of the U.S. population. Much of the ACS data provided on the Census Bureau's Web site are available separately by age group, race, Hispanic origin, and sex. Summary files, Subject tables, Data profiles, and Comparison Summary
read more


